
In this tutorial it is shown how to do statistics with data that comes from sensors which are connected to an Arduino. For this purpose, I use the open source statistic program “R”. Strictly speaking, R is a programming language targeting at statistical computing and graphics. Moreover, it has a huge community that works on tons of packages providing all kinds of algorithms. In order to get the data from an Arduino into R, I make use of an SD card reader/writer. Sensor data (that is captured by the Arduino) is written to an SD card, then read by a desktop PC and loaded into R.
The tutorial explains three aspects: (A) setting up an Arduino (Nano) with sensors and an SD card reader/writer to collect some data, (B) collecting data and transferring it to R, and (C) doing some statistics with the data.
List of materials:
| Arduino Nano | |
| Jumper wires | |
| Breadboard | |
| Ultrasonic sensors | |
| MicroSD Card Adapter | |
| MicroSD card | |
| Helping hand (very optional) |
A (1/2): Setting up an Arduino, some sensors and an SD card reader
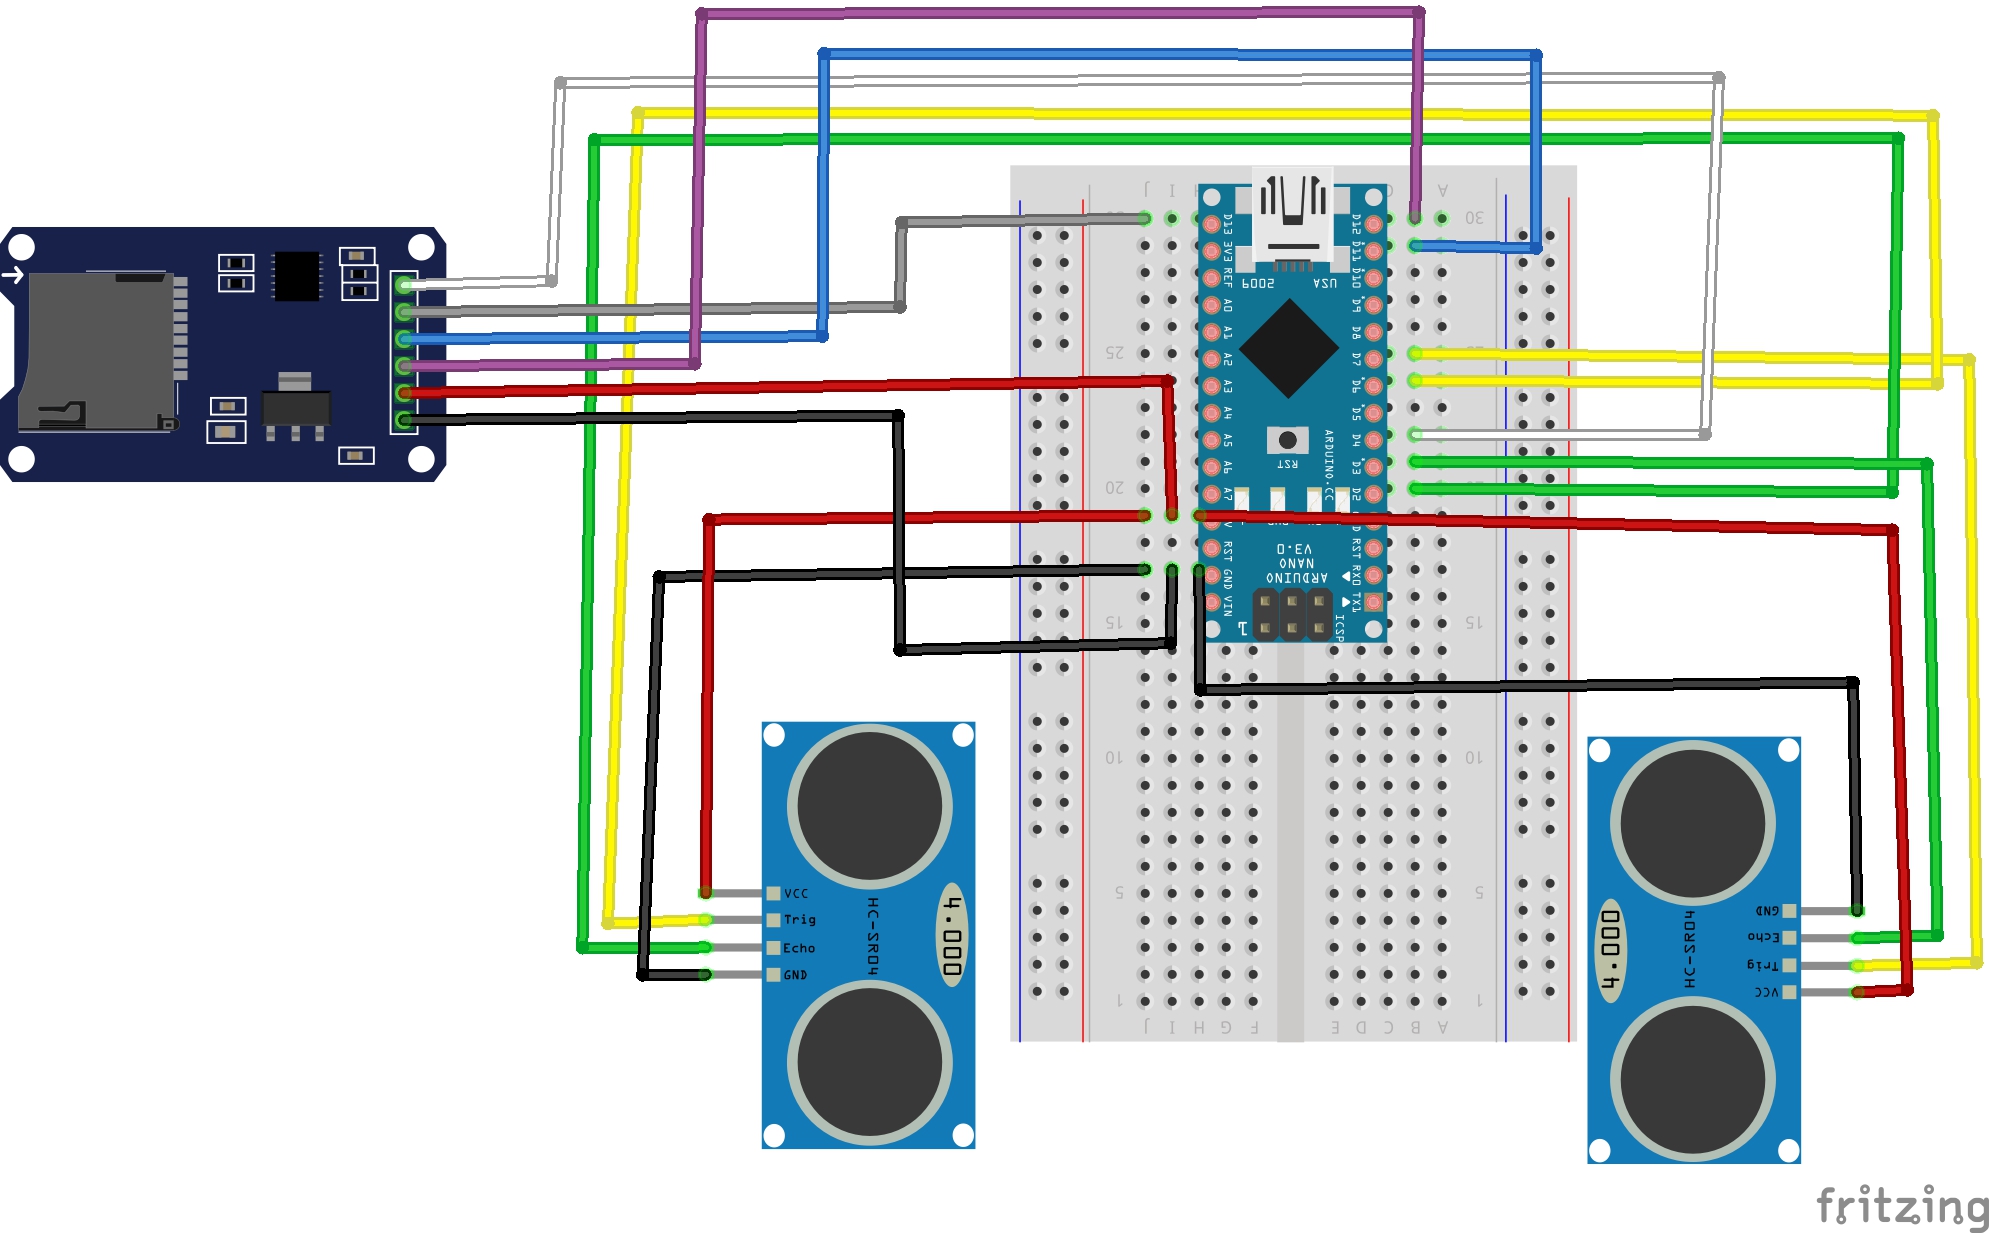
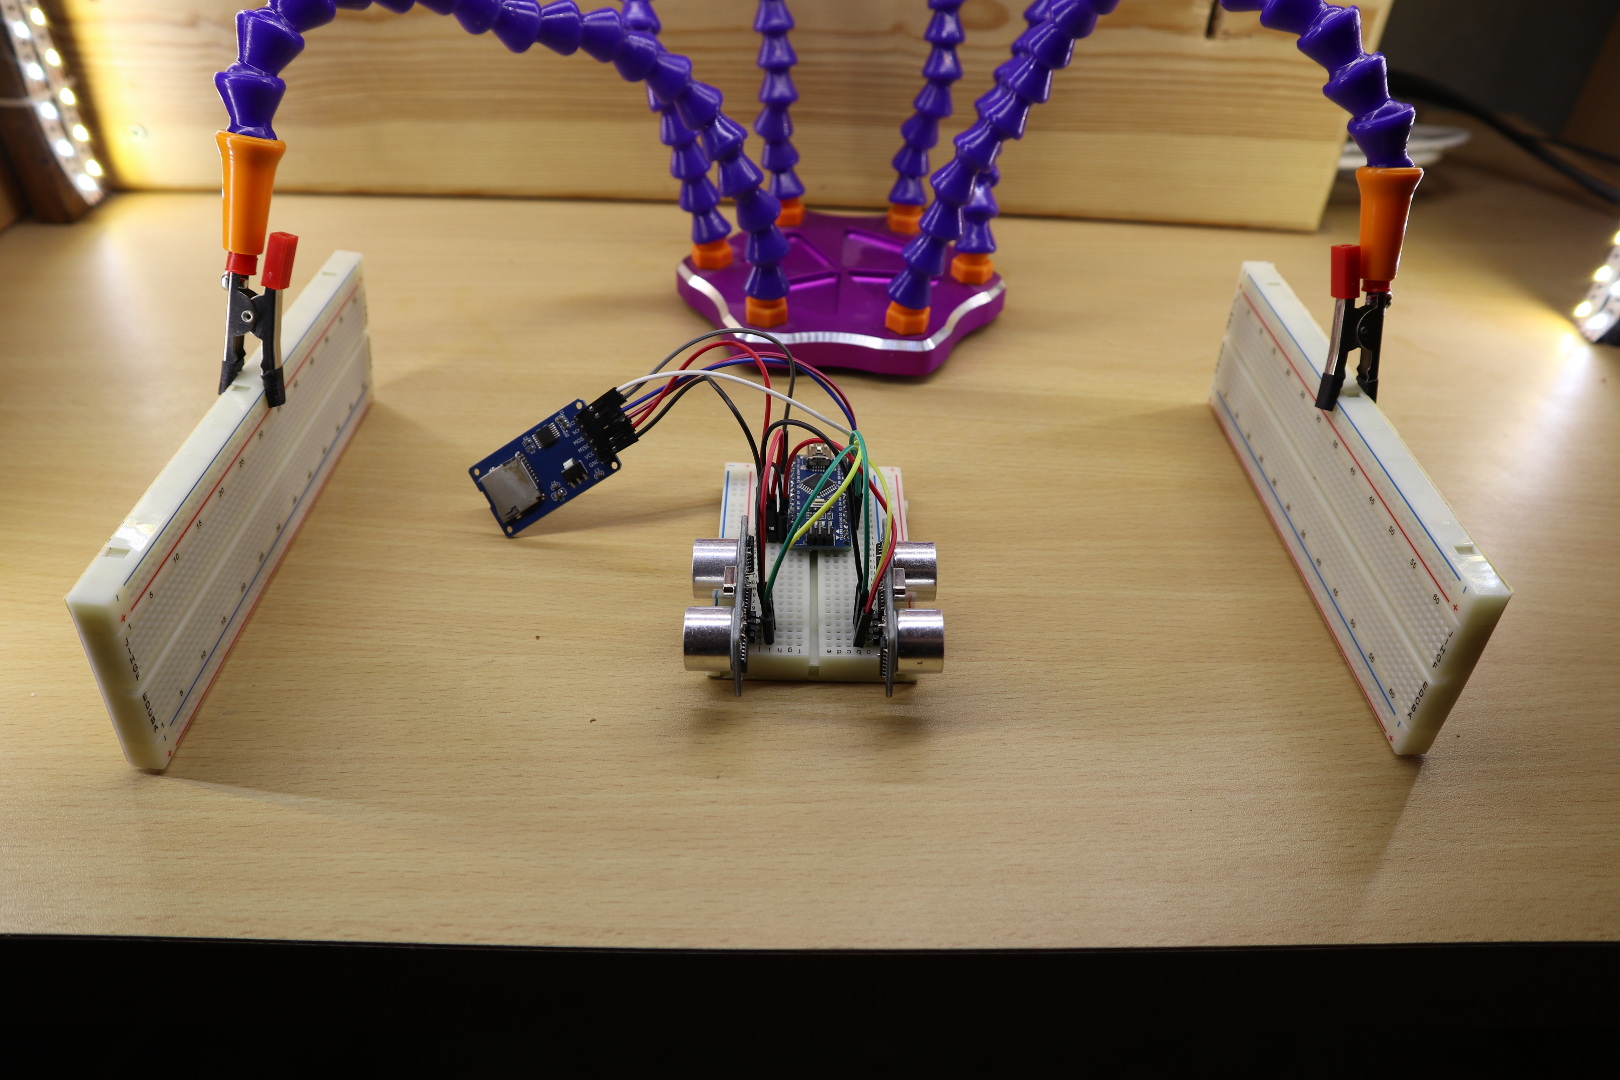
To be honest, the tutorial’s setup of an Arduino and sensors won’t make any real sense. It fulfills only one purpose: to collect some data that can be used to do statistics. I chose to use two ultrasonic sensors of type HC-SR04. In particular, an Arduino is plugged into the center of a breadboard. One ultrasonic sensor is plugged into the left part of the breadboard and the other sensor is plugged into the right part. As a result, the left sensor measures the distance to the left side and the right sensor measures the distance to the right side. I won’t cover the wiring in detail since I already wrote a tutorial that shows how to connect an HC-SR04 to an Arduino. In addition, I wire an SD card read/writer to the Arduino. Again, I won’t go into details here as I also wrote a tutorial about wiring an SD card reader to the Aruino.
In my previous tutorial about the HC-SR04 ultrasonic sensor, I made use of an approach that uses the pulseIn-function. This approach works well if you have only a single ultrasonic sensor in your setup. If you have two ultrasonic sensors that measure the distance at the same time, then this approach does not work anymore. In this tutorial, I make use of interrupts. These interrupts are triggered when the signal on the corresponding pin changes its state. On the Arduino Uno and Arduino Nano only digital pin 2 and 3 can be bound to interrupts. Therefore, the echo pins of the ultrasonic sensors are connected to digital pin 2 and 3.
A (2/2): Programming
As just mentioned, interrupts are used to measure the distances. Besides that, everything else is similar to the code that was presented in my previous tutorials about the HC-SR04 and Micro SD card reader.
On each loop function call, the distances are measured and then written to the file. Moreover, the old file is deleted on each startup of the Arduino.
// (c) Michael Schoeffler 2018, http://www.mschoeffler.de
#include <SD.h> //Load SD library

// Pins of the ultrasonic sensors
const int pin_echo_left = 2;
const int pin_echo_right = 3;
const int pin_trig_left = 6;
const int pin_trig_right = 7;

// variables that to track the duration of the echo
volatile long echo_left_start = 0;
volatile long echo_left_end = 0;
int distance_left = 0;

volatile long echo_right_start = 0;
volatile long echo_right_end = 0;
int distance_right = 0;

// variables to write data to sd card
int chipSelect = 4; //chip select pin for the MicroSD Card Adapter
File file; // file object that is used to write the data

void setup() {
  pinMode(pin_trig_left, OUTPUT);
  pinMode(pin_echo_left, INPUT);

  pinMode(pin_trig_right, OUTPUT);
  pinMode(pin_echo_right, INPUT);

  attachInterrupt(digitalPinToInterrupt(pin_echo_left), echo_interrupt_left, CHANGE); // only pins 2 and 3 are useable for interrupts on Uno, Nano and Mini
  attachInterrupt(digitalPinToInterrupt(pin_echo_right), echo_interrupt_right, CHANGE);


  pinMode(chipSelect, OUTPUT);
  if (!SD.begin(chipSelect)) { // Initialize SD card
    Serial.println("Could not initialize SD card."); // if return value is false, something went wrong.
  }

  if (SD.exists("stats.csv")) { // if "stats.csv" exists, fill will be deleted in order to gather new data
    Serial.println("File exists.");
    if (SD.remove("stats.csv") == true) {
      Serial.println("Successfully removed file.");
    } else {
      Serial.println("Could not removed file.");
    }
  }

  // write headers
  file = SD.open("stats.csv", FILE_WRITE); // open "file.csv" to write data
  if (file) { // Next, the headers (first line) of the CSV file is written
      file.print("DISTANCE_LEFT");
      file.print(",");
      file.print("DISTANCE_RIGHT");
      file.println();
      file.close(); // close file
      Serial.println("Headers were written to file!");
  } else {
    Serial.println("Could not open file (writing).");
  }


  Serial.begin(9600);
}

// this function is called by an interrupt on each change of the echo pin of the left sensor
void echo_interrupt_left() {
  switch (digitalRead(pin_echo_left))
  {
  case HIGH:
    echo_left_end = 0;
    echo_left_start = micros();
    break;
  case LOW:
    if (echo_left_end == 0) {
      echo_left_end = micros();
      long duration = echo_left_end - echo_left_start;
      long durationOneWay = duration / 2; // divided by two, since duration is a roundtrip signal
      // acoustic velocity of air at a temperature of 20°C => ~343.5 m/s
      // => 0.03435 cm/us
      distance_left = durationOneWay * 0.03435; // distance in cm
    }
    break;
  }
}

// this function is called by an interrupt on each change of the echo pin of the right sensor
void echo_interrupt_right() {
  switch (digitalRead(pin_echo_right))
  {
  case HIGH:
    echo_right_end = 0;
    echo_right_start = micros();
    break;
  case LOW:
    if (echo_right_end == 0) {
      echo_right_end = micros();
      long duration = echo_right_end - echo_right_start;
      long durationOneWay = duration / 2; // divided by two, since duration is a roundtrip signal
      // acoustic velocity of air at a temperature of 20°C => ~343.5 m/s
      // => 0.03435 cm/us
      distance_right = durationOneWay * 0.03435; // distance in cm
    }
    break;
  }
}

void loop() {
    // both ultrasonic are triggered to send an ultrasonic signal
    digitalWrite(pin_trig_left, LOW); // turn off the trigger
    digitalWrite(pin_trig_right, LOW); // turn off the trigger
    delayMicroseconds(3);
    digitalWrite(pin_trig_left, HIGH);// prepare to send "trigger" command to module
    digitalWrite(pin_trig_right, HIGH);// prepare to send "trigger" command to module
    delayMicroseconds(10); // wait for 10us (module sends signal only, if trigger had a HIGH signal for at least 10 us)
    digitalWrite(pin_trig_left, LOW); // module sends signal now
    digitalWrite(pin_trig_right, LOW); // module sends signal now

    delay(1000); // we wait a second... interrupts should be called by now

    // next we append the measurements to the CSV file.
    file = SD.open("stats.csv", FILE_WRITE); // open "file to write data
    if (file) {
      file.print(distance_left);
      file.print(",");
      file.print(distance_right);
      file.println();
      file.close(); // close file
      Serial.println("Values were written to file!");
      Serial.print("Left:  ");
      Serial.println(distance_left);
      Serial.print("Right: ");
      Serial.print(distance_right);
      Serial.println();
    } else {
      Serial.println("Could not open file (writing).");
    }
}
B: Collecting data and transferring it to R
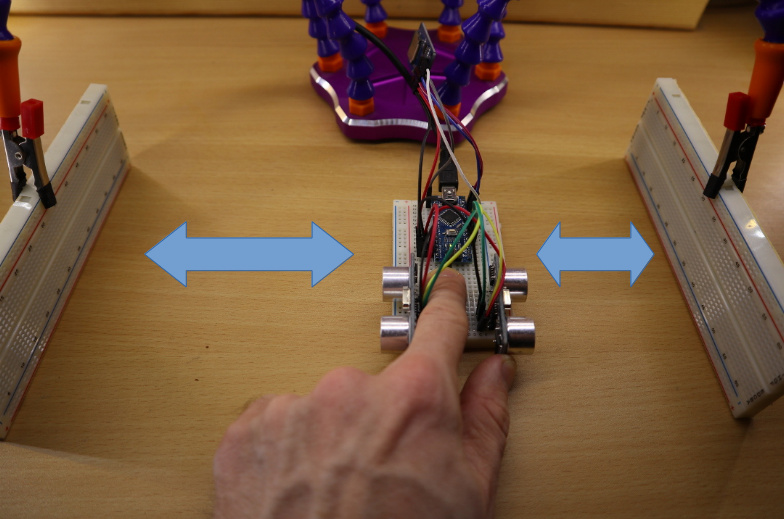
Next, some data is collected by simply switching on the Arduino and then moving it to the left and to the right for a little while. After some time, the stats.csv file on the SD card should have enough distance values. In particular, the Arduino program stores the distances measurements in a so-called Comma Separated Value (CSV) format. The first line of the stats.csv file represents the so-called header. The header contains the labels for the data. The next lines contain the actual measurements. Most statistics programs offer a functionality to import CSV files. Moreover, since CSV file can be found with slightly different formatting, statistic programs usually have some additional convenience functions to import a CSV file. For example, some CSVs have headers and others don’t have them. Furthermore, some CSV files separate the data entries by ‘comma’, others separate by ‘semicolon’.
C: Doing some statistics
So the next step is to plug the SD card from the Arduino’s SD card reader to a desktop PC. Then, the data from the SD card can be loaded to R. There exist many different graphical user interfaces for R. Usually, I use RStudio which makes R accessible especially for beginners. I won’t cover how to install RStudio. You can find more information about the installation on the RStudio website. Keep in mind that RStudio is only a user interface for R. Besides RStudio, you have also to install R itself. Moreover, this tutorial does also not cover an introduction to R. If you are not familiar with R, then you might want to take a look at an R tutorial for beginners in order to fully understand this tutorial.
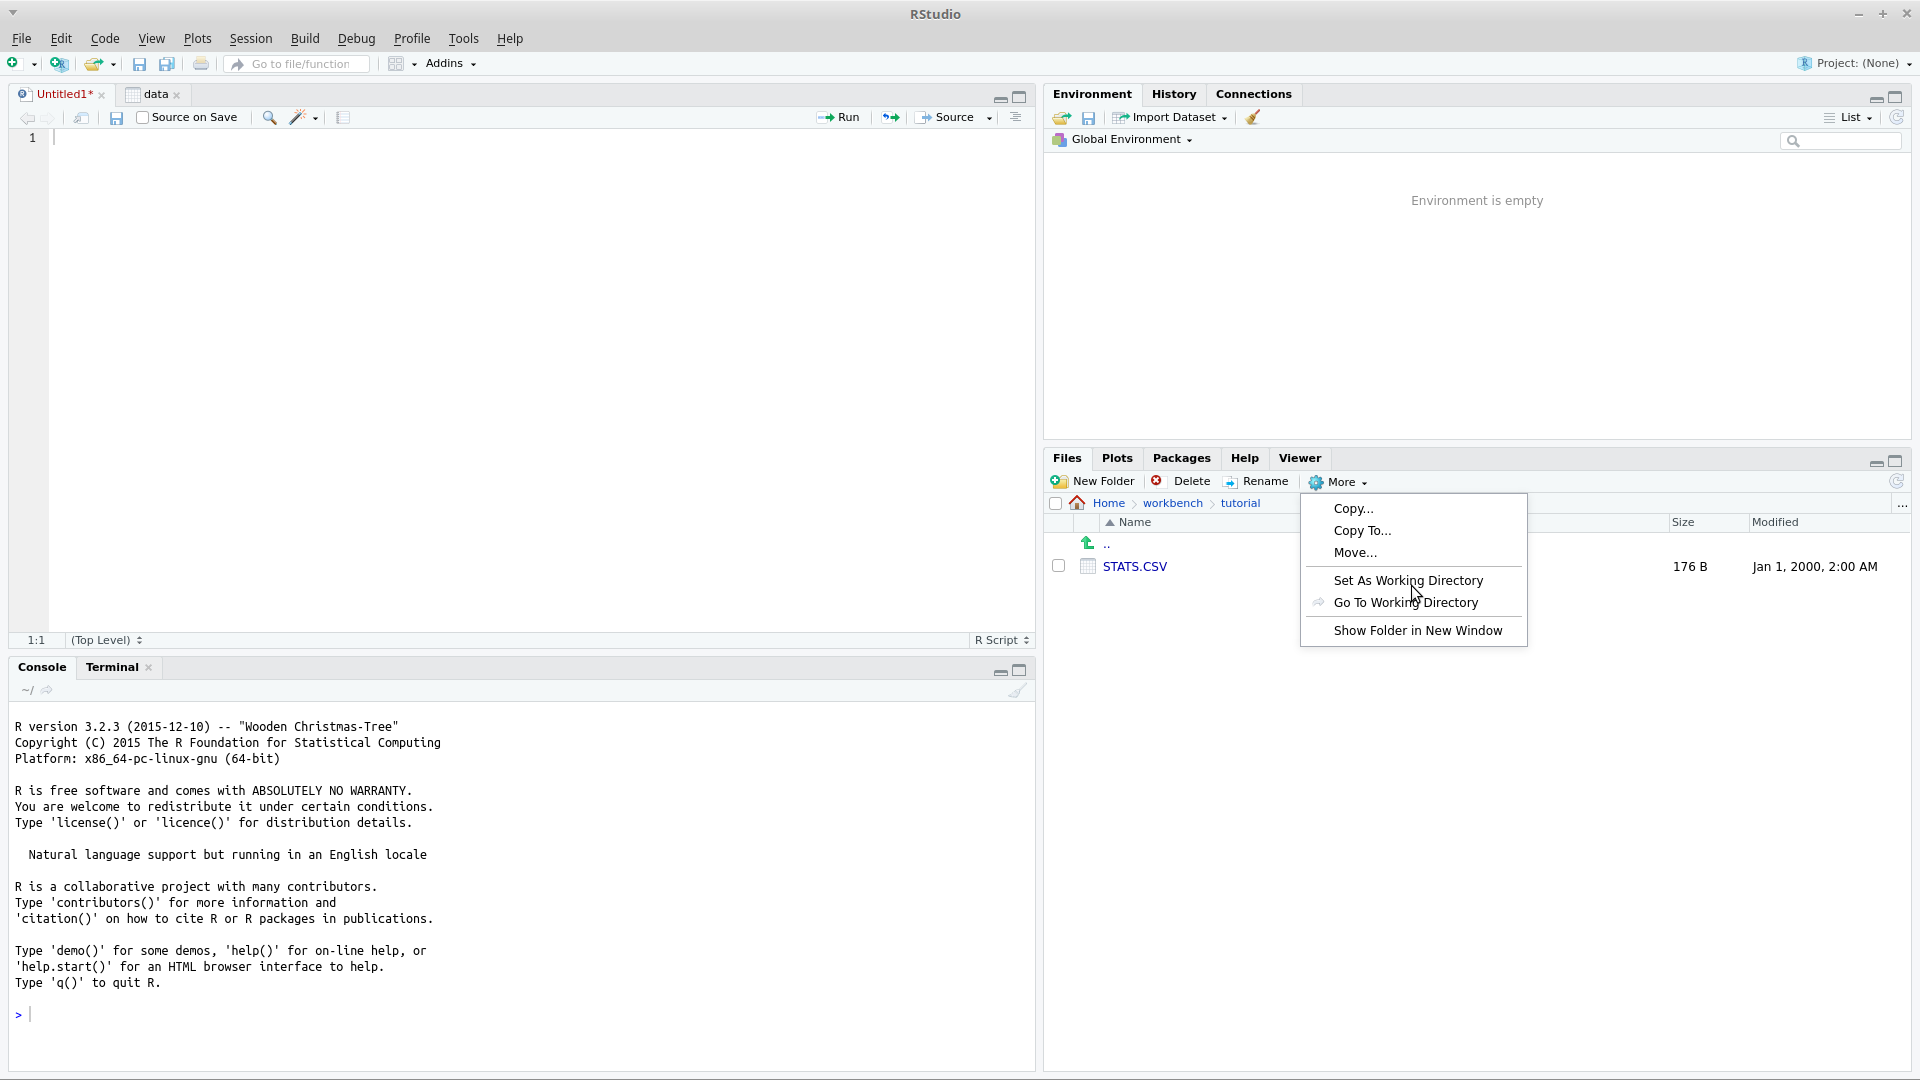
If you have installed R (and a graphical user interface), start with loading the file “stats.csv” to your R environment. In R, the environment is a place to store variables. In this tutorial, I set the working directory of R to the folder which contains the “stats.csv”. Typically, user interfaces such as RStudio offer a option for setting the working directory. In order to store the CSV file to the R environment, you have to enter data = read.csv("STATS.CSV"); to the R console. As a result, you should see that a variable “data” has been added to your environment. This variable should contain two variables and some observations for both variables. The number of observation is dependent on how long you took distance measurements with the setup. If you did not set the working directory, then you have to enter the full path to the CSV file into the “read.csv”-function.
Next, we want to calculate the mean values of our distance measurements. This can be done by entering mean(data$DISTANCE_LEFT)and mean(data$DISTANCE_RIGHT)to the R console. For the left distance I get 12.13043 and for the right distance I get 13.34783 [cm].
If you know only my mean values, you don’t know whether I actually moved my Arduino or not. I would be also possible that I just placed my Arduino in between the obstacles having a distance of about 12cm to the left and about 13cm to the right. In statistics, you can make use of the standard deviation which gives you some indication about the amount of variations of the observations. More strictly speaking, the standard deviation is the square root of the variance. Maybe you are asking yourself now “What is the variance?”. The variance is the average of the squared differences between each observation and the mean. In R, the standard deviations of the left and right measurements are calculated by entering sd(data$DISTANCE_LEFT) and sd(data$DISTANCE_RIGHT). The result values are 3.876554 (left) and 7.036326 (right). Normally, one would expect that the standard deviants are about the same for the left and right distance measurements. The differences are a result of a non-symmetrical physical setup, measurement noise, skewed movements of the Arduino etc. In order to check whether both variables are related to each other, a correlation measure can be utilized. The Pearson product-moment correlation coefficient, denoted as r, is such a measure. This coefficient ranges from -1 to 1. A value of -1 indicates that the two variables perfectly disagree, a value of 0 indicates that the two variables are independent, and a value of 1 indicates that the two variables perfectly agree. In R, the Pearson product-moment correlation coefficient can be calculated by entering cor(data$DISTANCE_LEFT, data$DISTANCE_RIGHT). As you can see, the function has two arguments which correspond to the two variables of interest. Applying the function to my data returns –0.7782926. This indicates that the two variables rather disagree. This sound logical because if we move the Arduino to the left, the left distance measurement decreases. At the same time, the right distance measurement increases. If both distance measurements had increased at the same time, the correlation coefficient would be close to +1.
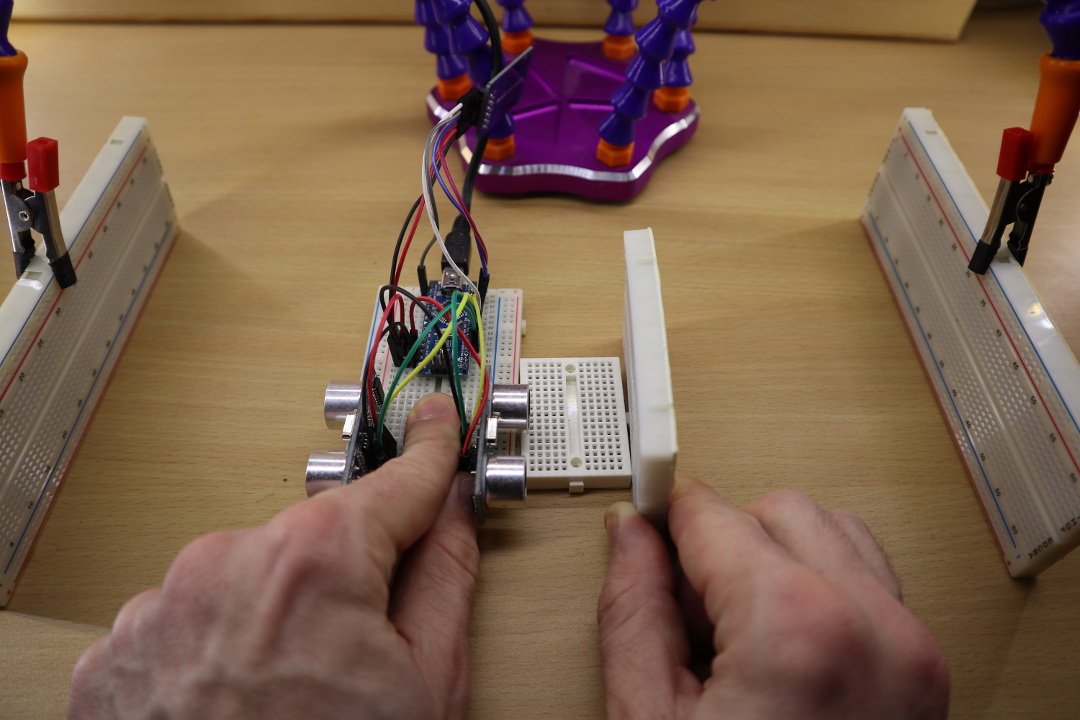
Let’s modify our setup. This time, I place an obstacle (mini breadboard) next to the right sensor while moving the Arduino (see picture). Then, I repeat the whole process to get the new data into R. Instead of storing the data values into the variable “data”, I create a new variable “data2”. The function call for reading the CSV file looks like this: data2 = read.csv("STATS.CSV");.
Next you can find the result values for calculating the mean values, standard deviations as well as the correlation coefficient:mean(data2$DISTANCE_LEFT)= 11.94737mean(data2$DISTANCE_RIGHT)= 3.421053sd(data2$DISTANCE_LEFT)= 3.822066sd(data2$DISTANCE_RIGHT)= 0.606977cor(data2$DISTANCE_LEFT, data2$DISTANCE_RIGHT)= -0.2054429
From looking at the statistics results alone, one might guess that something happened to the right sensor. For example, the standard deviation is very low (0.6…). If an obstacle is in front of the sensor, it will measure – more or less – the same distance value. As a result, the standard deviation is close to zero. Moreover, as one sensor measures the actual (varying) distance and the other sensor always measures the same distance, both sensor values are not correlated to each other any more. As a result, the correlation coefficient is close to zero.
You have seen that you can use statistics “to measure what is going on in the real world”. Moreover, at least in my opinion, statistics can be as useful as, for example, a multimeter when it comes to finding malfunctions of a system or bugs in you code.
Video tutorial:
Thanks so much, Jann!
The Arduino Tutorial: Making the KMR-1.8 SPI (TFT Display) work!
Perfect!! This (easy) code works directly, NO problems. It is not nessecerry to give the full filename in the code. I need this code for using by my modelrailroad.
Thank you. !! Best regards from Holland.